Investing in Profitable Revenue

I live in the “land of plenty” in Silicon Valley – aka there are plenty of startups that don’t have their go-to-market (G2M) figured out. I can’t tell you how many times I’ve heard about “great technology” but there is little to no product/market fit or ability to reach their buyers properly….or a combination of both. If you have product/market fit and a clear path to your buyers…well, you have an opportunity to create some profitable revenue growth.
At this point in the Janrain journey (having one quarter behind me) I made sure the whole company knew what to expect for 2016. Change was underway, and we settled into our overall 2016 theme as “Execution with Repeatability”. By end of 2016, I wanted to have clear visibility into every aspect of the business that was accurate, automated, and scalable. But this wasn’t the only thing we did…there were a few things to fix along the way.
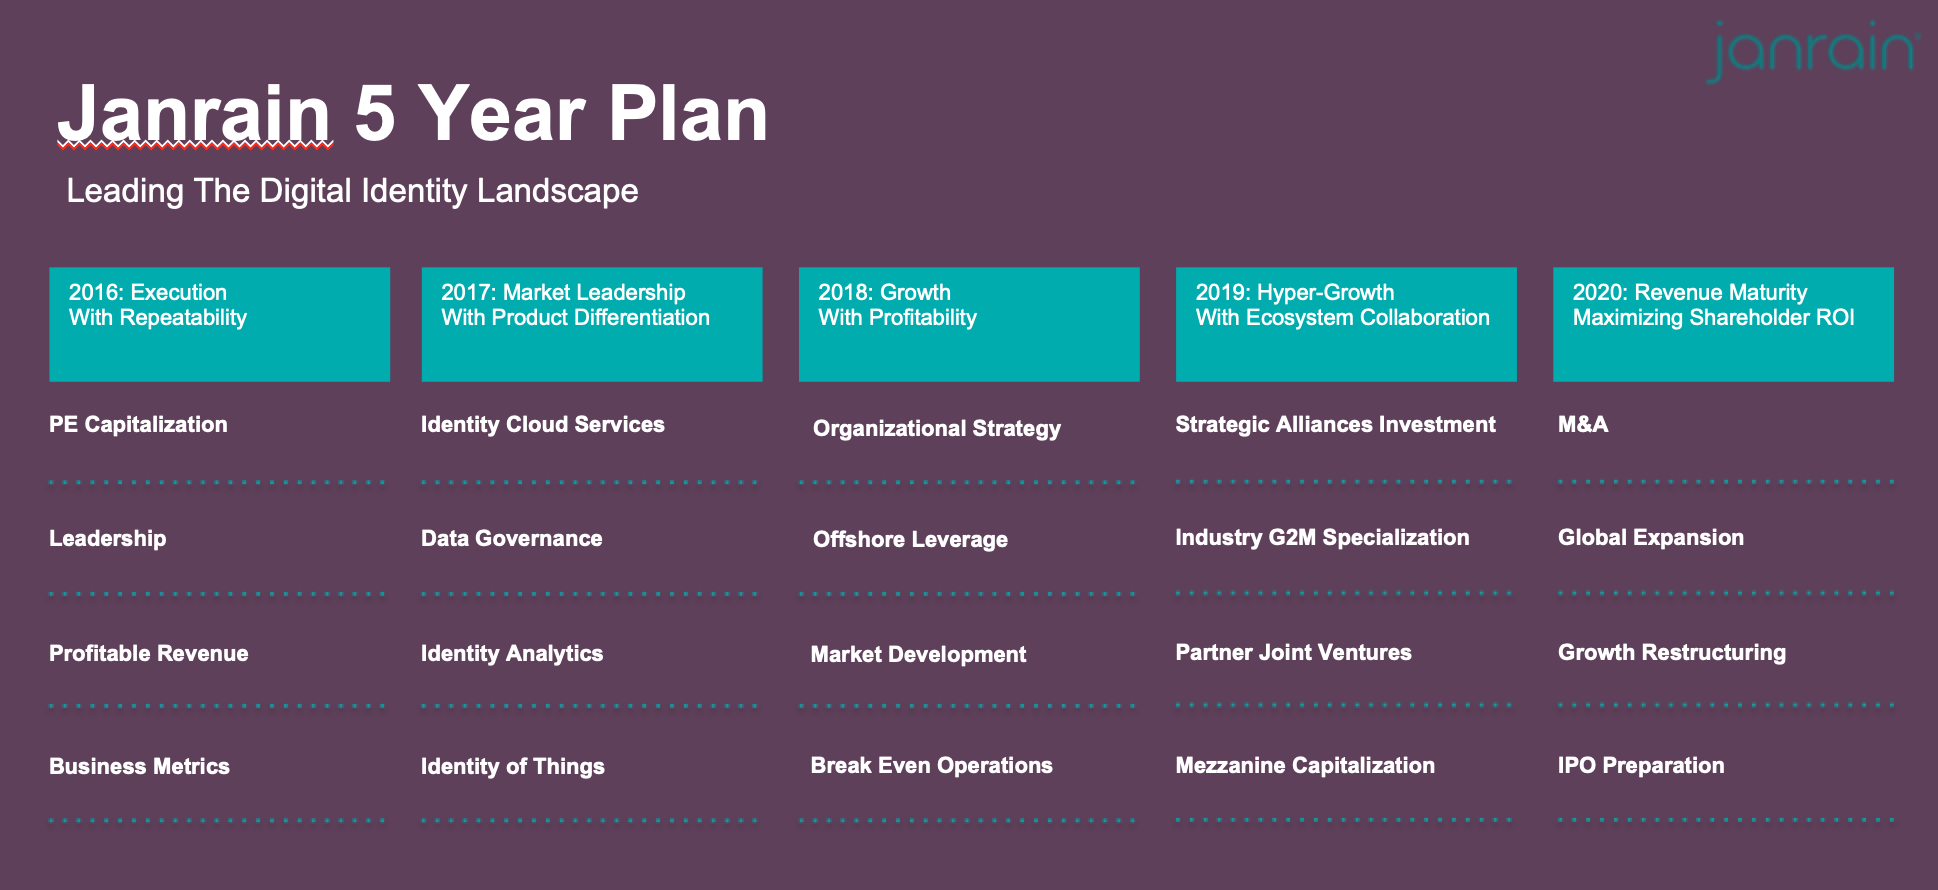
Our 5 year plan
In order to establish a roadmap for the entire company to follow – ultimately providing the guide for the change we were architecting change – we created annual and quarterly themes for 5 years. It was my way of being in every meeting, every hallway discussion, participating in every decision…not physically, but virtually by giving the staff a roadmap for the business’ transformation.
Profitable Revenue (Qtr 2 out of 11)
This annual theme was further supported by the following quarterly themes and associated messages (straight from materials shared with the staff):
- Q1: Setting the “HighBar” – HighBar is more than a PE investor. They are an extension of our team and have the resources to assist us in being successful. This quarter has been about HighBar and Janrain setting the basis for a long-term partnership.
- Q2: Taking the “Tribalry Summit” – This is about leadership – starting with the senior team learning how to take the more difficult paths, challenging ourselves to do things differently, and preparing ourselves for the change needed to fuel our growth.
- Q3: Investing in “Profitable Revenue” – This quarter is about not only continuing our investment in our Sales and Marketing model, but proving that it will result in profitable growth.
- Q4: Proving our “Repeatability” – By the end of 2016 we need to achieve repeatability across ALL parts of our business, from engineering, to delivery, to sales and marketing with clear, measurable metrics. This will be a must-have, entering into 2017.
3Q16 Playbooks
In 3Q16 we applied the following playbooks:
- Product Innovation MVP: Using outside consultants to help establish a thesis on future potential MVPs we could use to differentiate the company (we used IDEO + Datascope).
- Use-of-Funds Workshop: Making sure we are always spending our money on the right areas of the business
- Top 3 Issues Processing: Brainstorming on what the entire company would attempt to solve in the next quarter across organizations.
- Business Metrics Walkthrough: Knowing your key metrics by business function, know the industry benchmark, and starting to devise a plan on how to accurately capture and compare on a monthly basis.
- Painted Picture: We created “2016 Goals” by senior team member (what would “success” look like for each exec year-end on December 31st, 2016?), and then I pushed past 2016 to a mid-point in the 5-year plan, aligning the team behind the goal of: 1) revenue = 2x of 2016, 2) requiring 50% YoY booking growth, 3) profitability (or cash-flow BE), 4) all by mid-2018 (2 years from the exercise).
- Profitability (P&L) by Customer: The purpose of the exercise is to address questions like: 1) What is the “cut-off” for a customer worth pursing? Do we use size of identity footprint? ARR? 2) How do we operationalize this with sales? ARR minimum? 3) Effectively filter out in our qualification process 4) What do we do with the existing customers who fall “below the line”? Fire them? How/When? 5) How do we improve profitability of existing and future customers (aka higher GM)?
- Sales Strategy & Plan: Profitable revenue requires a sales strategy by region, by rep, by product. We had to redefine account assignments, a minimum ARR target, and pipeline qualification (pick your methodology: ANUM or BANT)
- Professional Services Capacity Planning: Addressing capacity concerns so that we don’t trip up sales with the lack of ability to deliver.
- Customer Success DRR Review: This is a detailed exercise in planning to achieve a healthy Dollar Retention Rate (DRR). It is a “twelve-step” process including: 1) DRR YTD (Gross Retention + Add-on) vs. Goal; 2) Total Year Outlook/Projection (Closed-Won, Commit, Forecast to close, Closed-Lost); 3) By Quarter Q1-Q4; 4) Q1 Loss Summary; 5) Q2 Loss Summary; 6) 2H Upcoming Renewals by Account; 7) Analysis on Add-Ons vs. Price-Downs 8) Health by Account; 9) Utilization of platform by Account (Used vs. Sold); 10) Red Account Plans; 11) Summary of Customer Success Manager assignments; 12) Key Accounts with Plans vs. Yet to be completed.
- Partner Strategy & Plan: This includes: Key KPIs, partner category definitions, associated business models (including target gross margins), matrix in steady state, quarterly plan and objectives summary with “asks”.
- Cost of Customer Acquistion by Market Segment: Customer acquisition cost (CAC) is a metric that has been growing in use for SaaS companies. The CAC can be calculated by simply dividing all the costs spent on acquiring a customer (marketing and sales expenses) by the number of customers acquired in the period the money was spent. For example, if a company spent $100 on marketing & sales in a year and acquired 100 customers in the same year, their CAC is $1.00.
- Product Backlog Prioritization: How to measure: 1) roadmap item value to the business (customer $revenue increase, customer sat increase, cost of infrastructure decrease), 2) Level of effort associated in building, 3) Risk associated in our estimates; 4) priority = function of (value / cost) * Risk Factor.
- Engineering Velocity Allocation: Early on we began to measure and target how we allocated our “build engine” of engineering talent. We categorized by: 1) Run the Engine (RTE) which included production support and maintenance, 2) Customer Commits which included product roadmap items we knew customers needed (in some cases we needed to commit to in order to win RFPs), and 3) Innovation which covered our experimentation and more advanced new capability research (adv R&D). The desire was to get to a 20/60/20 vs. the 60/35/5 we were at during this particular quarter.
- Corporate Development Strategy: Senior team analysis of 1+1=5 scenarios – categories of ecosystem players, brainstorming with one leader in each category.
- Executive Sponsor Program: Goals, duties as an executive sponsor, selection of customers and executive sponsors.
- Product P&L and Customer ROI Analysis: This is an exercise that supports categorizing your offerings into the BCG matrix of 1) Dogs, 2) Cash Cows, 3) Questions Marks, 4) Stars.
- Vision, Mission, Values + Employee Sat: This is one of my focus areas, as it anchors across so many parts of the business, including G2M. We also included a workshop on how to properly measure internal employee satisfaction, knowing that change management was going to be key. We set up the TinyPulse platform, established a monthly “Cultural Ambassador” program, and encouraged “cheers for peers”. We also kicked off a “values” initiative which involved the whole company.
- Pricing & Packaging: A complete overhaul in the pricing model, effectively an increase in all pricing by 20%, the addition of support tiers, etc. How else can you achieve the “profitability” component along side of revenue growth?
- Top 5: Setting Quarterly “Top 5 MBOs” by business function (and executive) <- key for alignment.
QBR Guests – Laying the Innovation Groundwork
We also invited the founder, Dean Malmgren, of Datascope, a data science consultancy of over 20 of the brightest data-savvy minds (and later acquired by IDEO). My agenda with Datascope/IDEO was to establish the basis for long-term competitive advantage at Janrain, using the network of identity data available to us. We brainstormed 487 potential use-cases that the Janrain data could support. Out of those we ranked and chose the top four:
- Developer Love: Data-driven tools for dev/tech support
- Customer Journey: “Shades of Grey” (from initial unknown user to high customer lifetime value)
- Customer Risk Scoring / Segmentation: How to protect your digital identity
- Peer Benchmarking: One customer relative to the “network” of other customers.
We initially prioritized developing our anonymous data tracking capabilities while partnering with a risk-score partner (Iovation, Threatmetrix, and/or Telesign) to accomplish an early MVP on “Customer Journey” and “Customer Risk Scoring” respectively. We also agreed that our “Identity Analytics” needed a complete overhaul to support both “Developer Love” and “Peer Benchmarking”. Therefore, we needed to move off of Tableau and adopt Looker for our Identity BI.
As a side-note, it was becoming apparent was that no one at Janrain understood how to build a scalable data and analytics capability and that we also lacked the Product Management leadership as it applied to data products. We needed to focus on the team as much as we did the strategy and tech.
3Q16 Top 3 Issues
- Long-term Stability of the Platform: How to achieve 99.999% consistently (based on our strategy to go after the high-end customer).
- Delivery Partners: How to prepare to deliver on what we sell (and profitably) through an ecosystem (vs. building too much PS into our P&L).
- Increase sales pipeline for 2H16: Reshaping our pipe with >$1B profile clients and adopting a better qualification criteria overall.
The Team

We managed to get out to do some zip-lining at the Pumpkin Zip Tour just outside Portland. It was a fabulous zip that reaches heights of up to 120 feet during our two hour canopy tour.
Summary of quarters:
2Q16: Supercharging Your Leadership Team (Qtr 1 out of 11)
3Q16: Investing in Profitable Revenue (Qtr 2 out of 11)
4Q16: Making a Business “Repeatable” (Qtr 3 out of 11)
1Q17: The “aaS” Delivery Model (Qtr 4 out of 11)
2Q17: Compliance in the Cloud (Qtr 5 out of 11)
3Q17: Analytics in the Cloud (Qtr 6 out of 11)
4Q17: IoT affects All – Even Identity (Qtr 7 out of 11)
1Q18: Organizational Strategy (Qtr 8 out of 11)
2Q18: Extension Teams (Qtr 9 out of 11)


