Big Data and Graphs = Big Graph?
I’ve been very intrigued by graphs and their potentially broad application leveraging Big Data and Big Analytics. I don’t mean the idea of mining your twitter feeds or Facebook friends. Don’t get me wrong. The idea of targeting your brand’s influencers in the “social graph” with a social media marketing campaign is great. Lots of companies are chasing this as we speak (probably too many).
What I’m thinking could be Bigger….as in Bigger Data, Bigger Analytics, and Bigger Picture. People don’t realize that most applications today handle data which is inherently deeply associative, and becoming more and more graphical in nature.
What is a Graph?
 First lets make sure we understand the concept behind graphs. A graph is a collection of nodes or vertices (things) and edges (relationships) that connect pairs of nodes together. Associate an arbitrary amount of properties (key-value pairs) on the nodes and relationships and you have a surprisingly powerful way to represent most any data. You could look at a graph data store as a key-value store, with full support for relationships.
Graphs are among the most ubiquitous data models of both natural and human-made structures. They can be used to model many types of relations and process dynamics in physical, biological and social systems. Many problems of practical interest can be represented by graphs. The question is whether Big Data and Big Analytics could leverage data in the form of a Big Graph.
In computer science, graphs are used to represent networks of communication, data organization, computational devices, the flow of computation, etc. For example, the link structure of a website could be represented by a directed graph. The vertices are the web pages available at the website and a directed edge from page A to page B exists if and only if A contains a link to B.
More specifically, lets take your Facebook page. It’s dynamically created based on literally millions of nodes and their edges in a large graph! There are the obvious nodes like users and friends, and less obvious nodes including comments, photos, videos, documents, your likes, and chat. Virtually every element of content is a node and the link between that element and another element is an edge in one of the largest graphs in the world.
Facebook is a relatively easy example. How about my Fortune 10,000 company? I have 15 products, and 3,000 customers. How large could my “graph” be and why do I care? Well, this is where you have to consider not only the element of “relationships” but also add in the element of TIME. You also have to consider user EXPERIENCE. Your customers do not operate in a bubble when it comes to interacting with your products and/or services. Check out my thoughts on “consumer experience“.
Experience over Time = Sequence Discovery
Associations (which are used to create graph structures) are items that occur together in a given event or record. Association tools or algorithms discover rules of the following form:
If item A is part of an event, then x% of the time item B is part of the event.
Associations are very popular in terms of market basket analysis – purchase of A also includes purchase of B (x% of the time). However, sequence discovery, which is closely related to association analysis, feeds directly into graph structures where items (nodes) are related (have relationships) over time. Here are some hypothetical examples:
- If a visitor of eBay.com visits the women’s jeans section (node), and spends 15 or more minutes browsing the website in a given week (nodes with time attributes), that visitor will have a 50% chance of buying jeans!
- If a visitor of eBay.com views the Levi’s 505 LONG Straight Leg Stretch Denim Jeans (node), they will have a 10% chance of purchasing the item (it’s on sale, and my wife is a sucker for sales).
- If a visitor of eBay.com does BOTH of the above, they have a 90% of purchasing those Levi’s 505 jeans!
Again, sequences are associations of events linked by time. Sequences of events are what make up your experiences. To take this one step further, once you have discovered meaningful sequences, you can also make predictions of future visitor sequences or final outcomes.
Time series forecasting, for example, uses a series of existing values to forecast future values. However, you have to know which values you want to use, and forecasting tools can take advantage of the distinctive properties of time, especially the hierarchy of periods (including the varying definitions of them such as the five or seven-day work week, the thirteen months year, seasonality, calendar events such as holidays, date arithmetic, and special considerations such as how much of the past is relevant to the future).
Experience Graphs
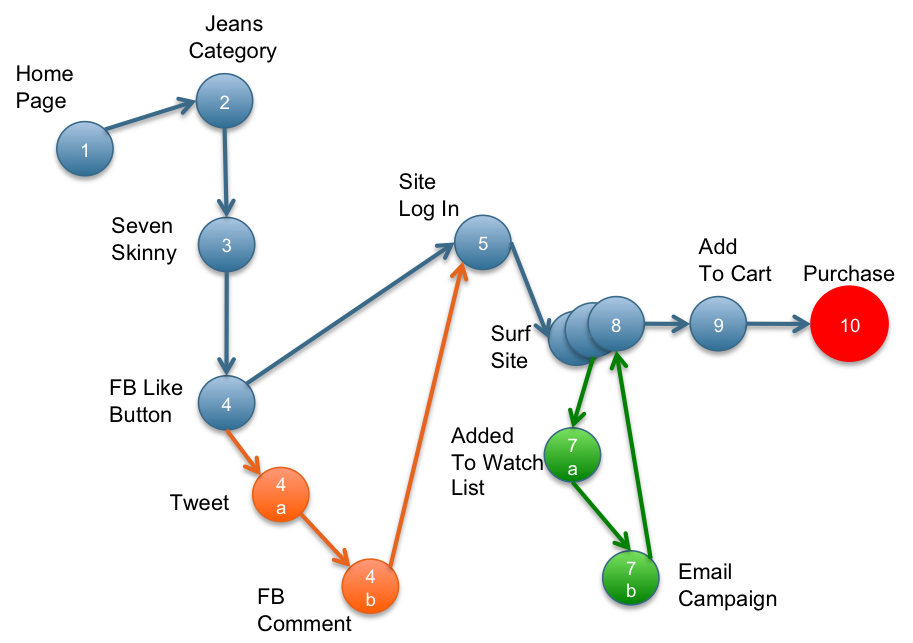
When I was surfing eBay.com yesterday and today with my wife, I noticed the following sequence of events:
- She started on the home page @ ebay.com
- She went directly to “Women’s Denim“
- She clicked on a pair of Seven Skinnies (she’s a premium denim snob)
- She clicked on the Facebook like button & we broke for dinner (at which time she tweeted about the jeans, which then resulted in a Facebook comment from one of her girlfriends saying “You Go Girl!”
- This morning she logged into her account
- She surfed around some more
- She added the Sevens to her “watch list” and we went to our kid’s soccer game (at which time she received an email with a 10% off any eBay purchase!)
- Upon returning, she visited the Seven page again
- She added the jeans to her cart & went to find me
- She asked me about it, and we pulled the trigger together!
These events are a collection of related events all associated with a single unique visitor (which can be tracked via IP address, browser cookies, and registered user information). We could analyze the click traffic in blue, track social content on twitter and Facebook in orange, and link other digital touch points such as the email campaign (part of a sophisticated multi-channel campaign management platform) in green.
Does my wife fall into the “standard” cluster of women shoppers? She’s probably in a small (but growing) group of quick to decide buyers who respond to friend’s influence on social networks as well as discount email offers (reading about them via her smartphone). I doubt she makes up the majority demographic. But I think this use-case is definitely growing.
The core concept here is the fact that we have information coming from many disparate sources and they can be represented in a sequence of related events over time which all make up a shopping experience.
Do you want to optimize a purchase, or a shopping experience?
Other examples of Big Graph problems…which could be viewed as Experience Graph opportunities:
- All the flights from and to airports can be organized as a graph. In this case, the airports are the objects and the flights are the relationships between the objects. Such a graph can be created for all the flights of one airline, or for a set of airlines. How does one offer up information to their customers based on real-time flight information to improve a travel experience?
- The accounts of a bank with all the inter-account money transfers form a graph. ACH with the Federal Reserve Banks, collectively the nation’s largest automated clearing house operator, consists of 60% of commercial interbank ACH transactions and EPN processing the remaining 40%. How does one analyze the ACH transactions to begin offering customized transactions for users to improve their banking experiences?
- All the parcel shipments between addresses world-wide can be organized as a graph. How does UPS, FedEx, or others improve delivery personnel and consumer experiences by minimizing delivery delays?
- In the context of telecommunications, all the call detail records between callers can be viewed as relationships between objects, and together they form an incredibly large graph. Are there ways to offer consumers with most frequently dialed information, same-carrier offers to reduce spend, recommended social applications, etc. to improve consumer experience?
Is the world one big experience graph with infinite subgraphs? How do we take advantage of Big Data, and time-based, and real-time Big Analytics?
Did you see Cray’s YarcData Graph Appliance? Only Cray.


One thought on “Big Data and Graphs = Big Graph?”
Comments are closed.